The steadily increasing amount of data is a direct consequence of progressing digitisation in all parts of life and demands easily accessible forms of representation that convey the overall situation and the change over time. Visualisation is thus an “intuitive” answer to the ever-increasing data overload and can be used for internal reporting or informing of the wider audiences.
In recent decades, a number of societal, managerial and technological developments have both enabled and increased the need for intensified reporting with recourse to increased visualisation of contents. Stower (2013) identifies the open government movement, the provision of open data and increased citizen participation as a main driver for visualisation. Likewise new technological developments - for example big data, data mining, data warehousing and business analytics - create new avenues for citizen engagement and the provision of eGov services which many governments are keen to exploit by increasing efforts to intensify offerings. (see figure 1).
Figure 1: Emergence of increased use of Data visualisation
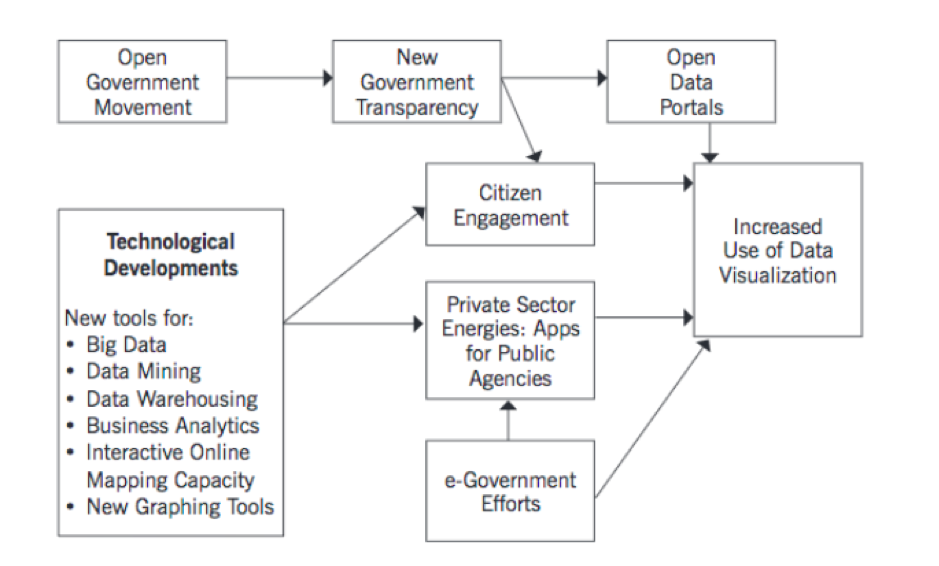
Source: Stowers, 2013.
“Interactive online mapping capacities” and “new graphing tools” are those technological developments that are of imminent importance for the topic to be researched as they actively shape the options at the interface between reporting and visualisation but also between the different actors in the field (administration to politicians, administration to citizens, politicians to citizens, administration to administration).
The project started here is the contribution of the Federal Ministry of Public Service and Sports (BMÖDS) to the ongoing discussions on public sector performance management in the EUPAN network. The findings will be presented and discussed within the network and further events during the Austrian EU Presidency.
Reference:
Stowers, G., The Use of Data Visualization in Government, San Francisco State University, IBM Center for The Business of Government, Using Technology Series, 2013.
Did you know you can vote on comments? You can also reply directly to people's comments.